
The viewport area where the unstable elements occupy space in both frames.
Core Web Vitals refer to an array of standardized Google metrics to help developers discern how users interact with the web page. Even if it was initially created for developers, businesses could utilize these measurements to gauge user experience (UX).
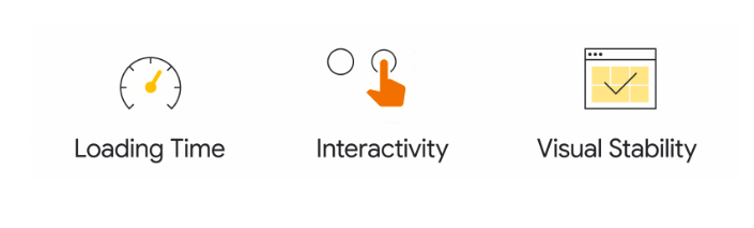
Google announced three metrics for web performance that have come to be called Core Web Vitals (CWV). The announcement was still part of the search engine giant’s goal to provide the best web experience for users.
The metrics are:
- First Input Delay (FID)
- Cumulative Layout Shift (CLS)
- Largest Contentful Paint (LCP)
Why Are Core Web Vitals Important?
CWV are considered to be essential indicators of the overall quality of a website and are used by Google to evaluate the performance of web pages and to determine their ranking in search results.
- Users are less likely to bounce from a page load when the website meets CWV benchmarks. Google places the decreased bounce rate to as much as 24%.
- Yahoo! Japan noted a 15% hike in page views per session by simply reducing the CLS by 0.2. The website also recorded longer session durations by 13% and decreased the bounce rate by 1.72%.
- Netzwelt increased ad revenues by 18% and boosted its page views by 27% after improving its CWV.
- Farfetch increased its conversion rate by 1.3% after reducing the LCP by 100ms.
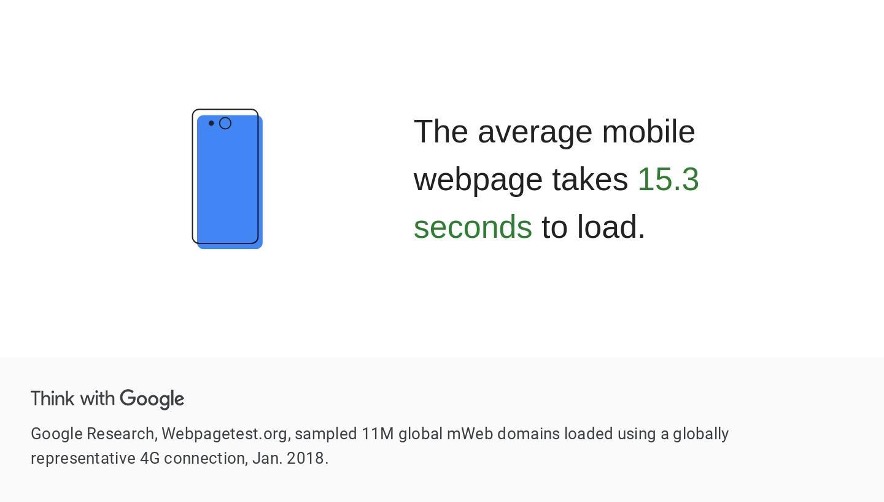
It’s no wonder you will notice high bounce rates for your website if you don’t address your page loading woes. The LCP tracks the time the page begins loading to when the website renders the most prominent image element on the screen. It will then assess when your primary contents have completed rendering.
However, the LCP only measures how fast the main contents are rendered on the screen. It does not take into account the elements below the fold.
So, the LCP will track the following:
- Background images
- Images
- Block-level text
- Video poster images
As a rule of thumb, you want the LCP to be as low as possible. An excellent barometer is when the page begins loading in 2.5 seconds or faster. Your webpage needs improvement when it loads between 2.5 seconds and four seconds. Meanwhile, your webpage has poor LCP when it loads for more than four seconds
Cumulative Layout Shift
Once the page has loaded, you need to make it intuitive for visitors to navigate your website. The CLS refers to a metric that classifies the buttons and links. It measures the difficulty level for users when trying to interact with the different elements in your webpage after it renders.
As you might expect, the user will get tired pretty quickly when the buttons are unresponsive or if the page changes elements while trying to soak in the information. The CLS, therefore, refers to your visual stability threshold. There’s nothing more frustrating when the website shifts elements when you are in the middle of reading. The CLS measures both lab data and field data.
Again, you want the CLS to be as low as possible for better visual stability. Unlike the LCP and the FID, the CLS doesn’t measure in seconds. Instead, it tracks movements between two frames and their changes in the viewport.
You will get the LCP score from the two components below:
1Impact Fraction
2Distance Fraction
The largest radius that the unstable elements shift between two frames, which you will divide by width or height according to the largest dimension in the viewport.
For best practices, you should aim for 0.1 or less CLS.
- Your CLS needs improvement if your score is between 0.1 and 0.25.
- Your CLS is poor if you score more than 0.25.
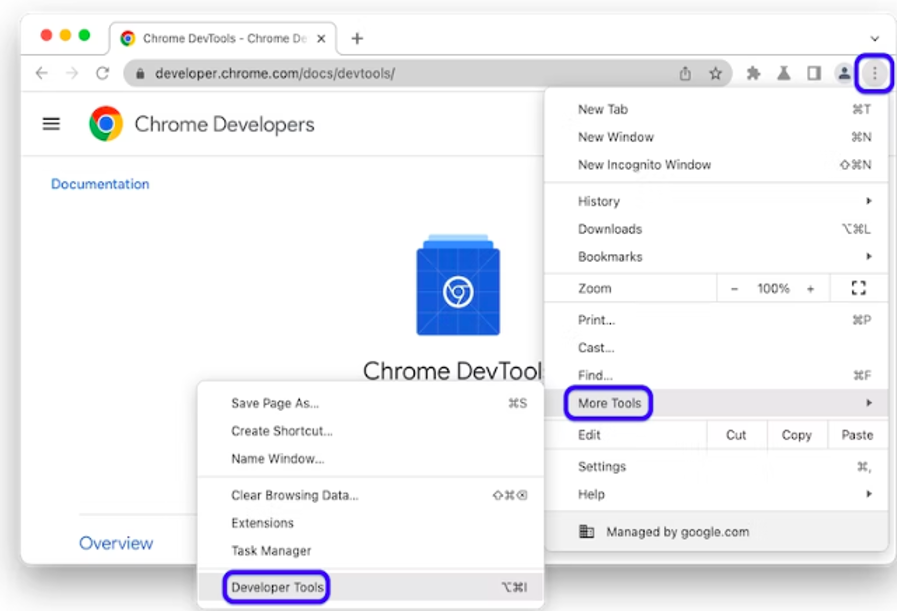
There are multiple reasons for the poor CLS score. But developers can examine the Chrome DevTools to gauge performance during the CLS audit.
This will help them identify the page’s layout shifts. In addition, the Experience section in the same tool will reveal the exact episodes of layout shifts.
Lastly, there might be some variance in your lab and field CLS tests. And this is due to the CLS continuing to track performance during the entire web page lifecycle. In contrast, the lab test will only measure data collected for a specific period.
First Input Delay
The FID tracks input latency or the time the page element responds to user input. You will find plenty of websites today that seem to value aesthetics more than function. While a pleasant-looking website does attract attention, it can only keep visitors for so long. In fact, you only sabotage your one chance to engage your audience by precisely addressing their pain points.
These visual enhancements will delay the time required for the page elements to respond to the user query. As a result, you will only frustrate your visitors, who will likely bounce off your page to go to the competitor’s site. The FID measures the speed by which your page responds every time the user clicks on a link or a button. It does not take into account the zooming or the scrolling actions.
Admittedly, FID is quite tricky to measure. The FID can only be gauged in the field, meaning that plenty of variables outside your sphere of influence will impact your overall score. For instance, the user’s device and Internet speeds will significantly affect the UX, which can muddle your FID score.
However, you can still test the FID in the lab using Total Blocking Time, a tool considered to mimic the conditions of an FID while taking away user interaction. You calculate the Total Blocking Time by summing up all the blocking sections of your long tasks.
As a rule, the lower the total, the better your TBT. Nevertheless, you want your FID to be below 100 milliseconds to be effective.
- You need improvement if your FID is 100 milliseconds to 300 milliseconds.
- Your website is poor if your FID score is more than 300 milliseconds.
Tools to Use to Check Your Core Web Vitals
You can use several online tools to benchmark your website’s performance against Google’s CWV.
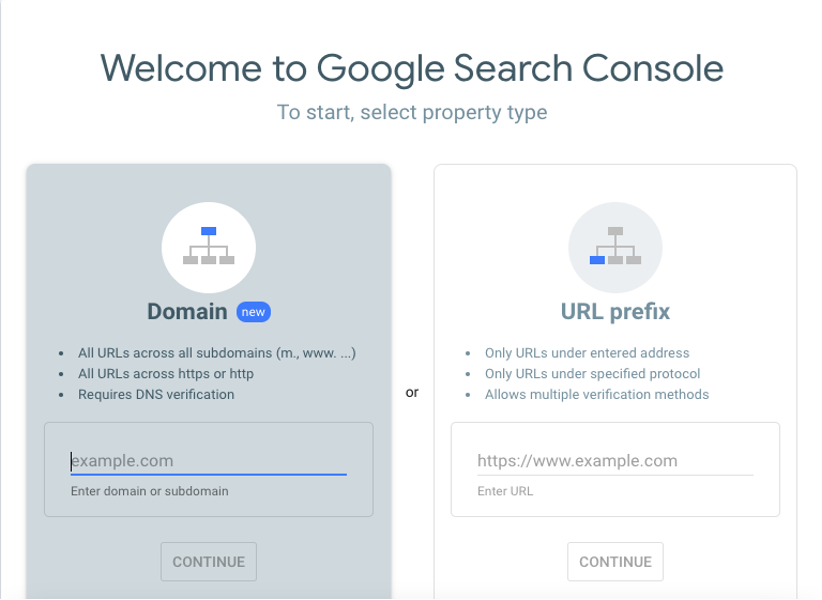
- Google Search Console — The free service enables you to track, troubleshoot, and manage your website’s rankings in the search engine results pages. It’s a handy tool for measuring your performance and traffic.
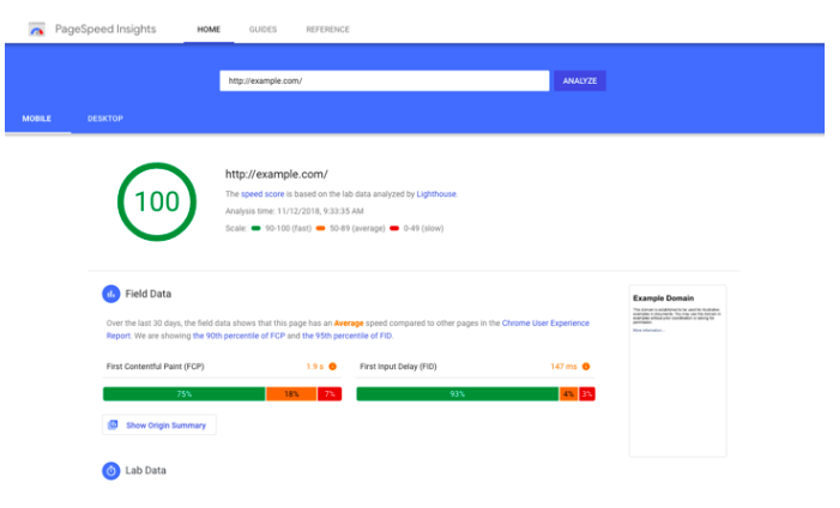
2. PageSpeedInsights — The tool will assess user experience when interacting with your website using mobile devices or desktops. The website also suggests ways to speed up your page loading rates to minimize the number of people bouncing off your site
3. web.dev/Measure — The tool was built and released by the Chrome web developer team, specifically designed to measure your CWV. The results will provide insight into your website’s performance in lab and field environments. As a result, you can put yourself in your user’s place, so to speak, and judge your metrics according to this perspective.
Don’t Ignore the Other Web Vitals
With that said, you must also consider the other crucial metrics beyond the CWV to understand user experience. As already mentioned, the Total Blocking Time can be an excellent alternative to the FID if you measure in a vacuum.
But there are other measuring tools, as well, including the following:
- Time to First Byte — It calculates the time required for the web page to load the first byte after the user makes an HTTP request. You can use this with your FCP to determine your page loading speed.
- Time to Interactive — It refers to that brief period when you finish the long task, followed by five seconds of inactivity in both the network and main thread.
The only reason these tools are not part of the CWV is that you can’t measure them on the field, which significantly impacts the user experience. While CWV are crucial tools to gauge your performance in relation to the UX, they cannot fully decode the entire user experience. After all, no system is perfect.
However, you now have a set of measuring tools that measure real-world performance. As a result, you can diagnose and take steps to improve your website’s efficiency to meet your business goals.
Meet The Author
