
You may come across some blogs where goal funnels or conversion funnels are used interchangeably. Sometimes, they call it a sales funnel. Regardless of the term, they are invaluable to the success of your business. It tracks the customer journey from lead generation, signup, purchase, and making sure they buy again.
It is particularly critical when you are trying to measure non-transactional endeavors. With e-commerce businesses, it is more straightforward to gauge the website’s success as it can be measured by profits and losses.
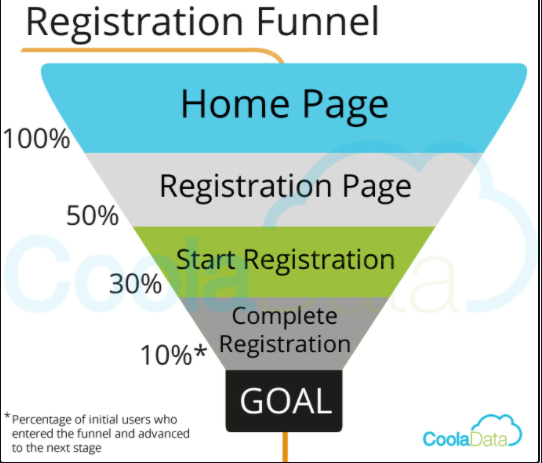
For example, in a typical e-commerce website, the potential customer will look at the products on the menu, click on the item of interest, add to cart, and then make the purchase. For some websites, they require a registration process, which is another step in the conversion funnel.
With these sets of metrics, you can gain an insight into the customer journey and calibrate your marketing efforts to boost the conversion rate. It saves you a lot of time and you get the most out of your investment.
In contrast, using the shotgun approach would get you nowhere. If you have no clear plan at the outset, you have no choice but pray that one of your shotgun shells will hit something.
Macro and Micro Funnels
There are two main ways you can set your conversion funnels in Google Analytics. One is the macro approach, and the other is the micro approach.
When you say macro, you are referring to the broader and generalized cross-channel goals to gain an understanding of your customers, how aware they are of your brand, how receptive they are about what you are offering, and how you can massage your message to reach out to them and trigger a response.
With the micro strategy, you become more deliberate in your goals to create specific and localized funnels on-site. So, you want to track how your customers are using your website, what links they are clicking, how long they stay on the landing page, how much time they are spending on your website, or if they are going back.
Goal Setting
Before anything else, you need to lay down your goals. The goal is the fundamental element in your conversion funnel strategy. Setting the wrong goals can send you off the beaten track, and lose your way in the process. Calibrating your goals to meet your objectives will allow you to measure the effectiveness of your digital marketing campaign properly.
For example, if you have an e-commerce site, the overriding goal is for a customer to make a purchase. If you are a developer of online games, you want users to download your title. If you are a news aggregate site, success can be measured by how many people you reach with your articles.
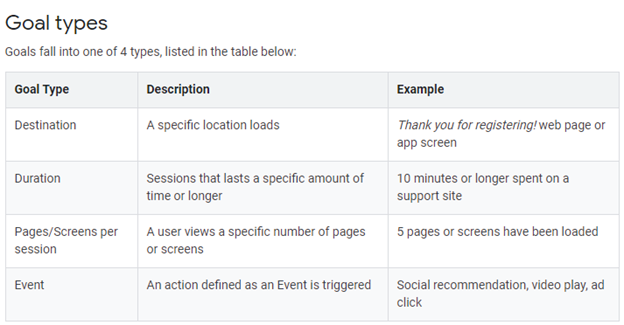 Source: https://support.google.com/analytics/answer/1012040?hl=en
To determine your goals, you need to answer the following questions:
- Is my marketing campaign driving leads and sales to my business?
- How long are users spending time on my website? What is the bounce rate?
- Are the goal steps clear to the users once they find themselves on your landing page?
- Is the website content delivering its designed objectives?
- Is your business generating enough interest via relevant traffic?
Defining your goals is the first step to creating a Google Analytics funnel.
- Sign up for your account in Google Analytics. You need to have Admin controls so you can make changes.
- Go to the Goals tab, then click.
- Make your Goal Name and then enter the URL for your Goal.
- The default Match Type would show as Exact Match. Leave it on, except if you also need to consider the different variations of your Goal URLs.
- Enter the Goal Value, even if you are not using your website for monetization. The step will enable Google to calibrate the metrics, as your Per Visit or Page Value.
Once you are finished and save your goals, you add the funnel first by using the checkbox. You can then enter the names or URLs on the steps box. You can have as many as 20 funnel steps.
(Note: You will see a box with the words “Required Step” under the Goal Funnel and next to the funnel steps. Checking the box will mean that the percentage of the visits on your Funnel Conversion Rate will include one page view of the 1st Step before the page view of the goal page.)
Limitations of Goals
Google Analytics has template goals that you can choose, but you can also customize your goals. Simply the goal name to avoid confusion in the future.
However, there are some limits when you are setting up goals. Here are just some of them:
- You need to set up the goals first in your Google Analytics account before the system will collect and report data.
- Each reporting view will only have 20 goals. You need to overwrite the goal that you do not need anymore. Alternatively, you can also create an additional reporting view.
- The goal data does not work like your standard Analytics data. You might be confused about the process, so you need to study non-standard data processing, particularly on the features.
- You can’t delete the goals. However, you can prompt the system to stop gathering data for a specific goal.
- You will be stuck with your goal sets and IDs after you have finished creating them. However, you can edit the goal name and the type.
- You can’t track goals retroactively. There are tools, such as Heap Analytics, that allow you to do this.
- It would have a hard time tracking multi-session actions. It is more reliable when tracking user action in a single session.
The conversion funnel will allow you to spot the pages where friction is present. From the funnel, the tool will immediately report that a user has dropped the goal steps. For example, with the online shop, you will know when the customer has dragged the product item to the cart but stopped short of completing the purchase.
Then you can start to sort out the problem.
- It could be a technical error, which kicks out the user and prevents them from purchasing the item.
- It could be a question of design where the multiple pop-ups and signups turn off the potential customer.
- The steps could be confusing, which forces them to abandon the process in frustration.
Since the reporting tool will allow you to see which stage of the funnel they abandoned the process, you can then develop potential solutions to avoid similar problems from occurring in the future.
You can also identify which goal steps that create the greatest bottleneck for many users. If you see an unusual number of visitors who dropped out at the specific step, then you can narrow down the potential glitch.
Setting Up the Conversion Funnel for the E-Commerce Website
There are three routes you can take when making the Google Analytics funnel report. You can click the choice from Conversions>Ecommerce. First, you need to enable Enhanced E-commerce Conversion and make sure that all the necessary elements are tracked.
- Shopping Behavior — It will allow you to check the number of sessions and steps in each phase of the purchase funnel. You can also see how many stopped in the middle of the goal funnel and totally abandoned the process, and how many completed the steps. Where in the step do you see a marked increase in the bounce rate? The report also has a visualization feature that will provide a quick view of the funnel.
- Reverse Goal Path — Not many people use this tool because they do not fully understand what it does. In Shopping Behavior and Funnel Visualization, you can clearly track the steps that the customer takes in the goal funnel. However, there are instances when the paths are disjointed. For lead generation sites, for example, they have contact forms that appear on several pages. The Reverse Goal Paths will help fill in the blanks and allow you still track their movements, whether or not they appear on the landing page, client directory list, registration page. The one limitation is that it does account for abandoned processes. The goal needs to be completed before it can be tracked.
- Funnel Visualization — The funnel visualization measures the number of times the users visit that particular step. It should not be confused with the page views. The funnel visualization shows each section that represents the percentage of the visitors who continue to the next step until the final destination URL. It should not be confused with the Goal Conversion Rate, which counts all the visits to your website. The tool will help you gain insight if the pages you set up are contributing to your conversion rate. For instance, if you are regularly posting blogs, you’ll know how many people are funneled from your articles and to the conversion page.
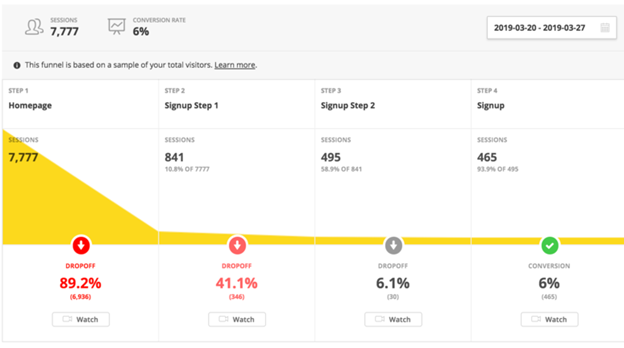 Source: Wikimedia Commons
The Funnel Visualization and Shopping Behavior will give you a peek into where you went wrong in your goal funnel. You simply do not bask in your successes because it is not an effective method to learn. You take lessons from your failures.
Setting Up Conversion Funnel for Non-E-Commerce Site
It is more difficult to set up this type of conversion funnel for your non-transactional website. There is no option within Google Analytics for you to do so. Some businesses tap third-party apps, while some possess the necessary tool to hack Google Analytics.
For example, you can use Google Data Studio, which enables you to filter the segments, such as users coming from the landing page or a specific channel. You can also segment custom profiles of users that have abandoned the funnel steps so that you can try to retarget them again.
You can also change some values and variables in the Enhanced Commerce funnel steps for results that are relevant to your needs. It is doable but quite complicated.
Funnel Conversion Rate
The Funnel Conversion Rate tracks the rate that the lead passes through the marketing funnel. Through this tool, you can gauge your marketing efforts’ effectiveness in completing the goals as you move toward the end of the sales funnel. Using the Funnel Conversion Rate, you can also modify your website to meet your objectives.
You can use the following formula when computing the Funnel Conversion Rate:
(No. of leads that move to the next stage ÷ Leads in the funnel stage x 100.)
You can also set up the frequency of the reporting, depending on your needs.
Even if you have what appears to be a good conversion rate, you still need to check each funnel to identify bottlenecks. Check the numbers on each section of the funnel from top to bottom. Determine which channel is not performing well, and then you can come up with ways to optimize it so that the channel will perform better. If you find other bottlenecks, address them as well.
But make sure that you finish optimizing one channel first before moving on to the next to avoid the overlapping of strategies.
The 2019 US Consumer Electronics Report revealed that the average conversion rate from visit to purchase is around 3% across different industries.

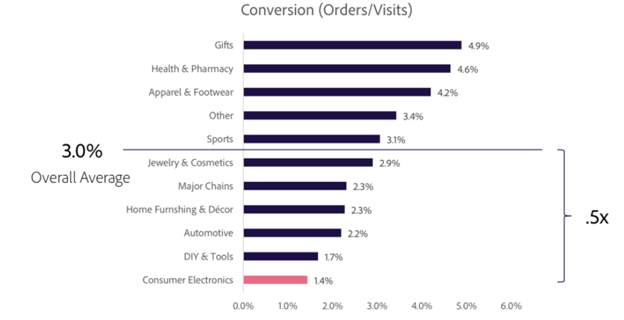 Source: https://www.slideshare.net/adobe/adi-consumer-electronics-report-2020
The Funnel Conversion Rate will depend on your industry. As cited in the report, the conversion rate was only 1.4% in the electronics industry, which is quite dismal. If your conversion rate is between 3% to 5%, you can be confident in your marketing strategy. As long as you do not drop below 2%, then you are good.
Conclusion
The Conversion Funnels in Google Analytics is a useful tool to help your business calibrate your marketing campaigns, create a better experience for your customers, and address the bottlenecks on your website. By identifying the problem as early as possible, you can immediately optimize the channel and improve its performance. Make sure that you identify the funnels and goals in the earliest stages of your implementation process.